Showing posts with label SSRS. Show all posts

Walkthrough: Creating a Report Bound to a Report Data Provider Class (X++ Business Logic) [AX 2012]

In this walkthrough, you use a report data provider (RDP) class with business logic to process data and then display the outcome of the business logic on a report.

An RDP class is an X++ class that is used to access and process data for a Reporting Services report. The options for a data source type for a Microsoft Dynamics AX report are query, business logic, and RDP. An RDP class is an appropriate data source type when the following conditions are met.

  1. You cannot query directly for the data you want to render on a report.
  2. The data to be processed and displayed is from Microsoft Dynamics AX.

The following illustration is a preview of the report that you create in this walkthrough.

clip_image001Note

The data that displays in your report may vary depending upon the sample data that is available to you.

The following elements are required to set RDP as your data source type.

  • Temporary table – RDP class fills a temporary table with data that will be used by Reporting Services to display the report.
  • Data contract class – defines the parameters in the report.
  • Report data provider class – processes business logic based on parameters and a query, and then returns the tables as a dataset for the report.

This walkthrough illustrates the following tasks:

  • Creating a temporary table
  • Defining a report data provider class
  • Defining the report parameters
  • Defining a method to return data to Reporting Services
  • Adding business logic for the report
  • Creating a reporting project
  • Binding a report to a report data provider class


Creating a Temporary Table

Data for an RDP report is preprocessed and then stored in a temporary table. The temporary table is used by Reporting Services when the report is displayed. A table returned by a method can be a temporary table (InMemory or TempDB) or a regular table. When the data returned is used for reporting only, it is a best practice to use a temporary table.

  • Use an InMemory temporary table if the dataset is small, for reports that will display fewer than 1000 records.
  • Use a TempDB temporary table for large datasets to improve performance.

In this section you will create a temporary table to store the data for the report.

To create a temporary table

  1. In the AOT, expand the Data Dictionary node, right-click the Tables node, and then click New Table.
  2. Right-click the table, and click Properties.
  3. In the Properties window, set the Name property to TmpCustTableSample and set the Table Type property to TempDB. This will define the table as a SQL Server temporary table.
  4. Expand the node next to the TmpCustTableSample table so that you can see the Fields node.
  5. Press Ctrl+D to open another AOT window and move the window so you can see both AOT windows.
  6. In the second AOT, expand the Data Dictionary node, expand the Extended Data Types node, and drag the following types to the Field node in the first AOT window:
    • AccountNum
    • CustName
    • LogisticsAddressing
    • CustGroupId
    • Phone
    • CustInvoiceAccount
    • ActionDays
    • InclTax
  7. In the second AOT window, expand the Base Enums node and drag the CustAccountStatement enumeration to the Fields node of the first AOT window.

Defining a Report Data Provider Class

The RDP class is a data provider that allows you to add business logic for the data that is displayed on a report. The business logic for this example prompts the end user for parameter values, processes business logic to generate data in a table, and then returns the table to render in the report. In this section, you define the RDP class by extending the SRSReportDataProviderBase class. Then add the TmpCustTableSample table as a global variable. The following list describes the attributes that are attached to the RDP class for this example:

  • Attach the SRSReportQueryAttribute attribute to specify the query to use to get the data for the report.

For this example, set the attribute to the Cust query.

  • Attach the SRSReportParameterAttribute attribute to specify the data contract class that defines the report parameters for the report.

For this example, set the attribute to the SrsRDPContractSampledata contract.

To define a report data provider class

  1. In the AOT, right-click the Classes node, and then click New Class.
  2. Right-click the new class, click Rename, and then enter SrsRDPSampleClass.
  3. Expand SrsRDPSampleClass, right-click classDeclaration, and then click View Code.
  4. In code editor, enter the following code in the class declaration to define the class.

X++

[

SRSReportQueryAttribute (querystr(Cust)),

SRSReportParameterAttribute(classstr(SrsRDPContractSample))

]

public class SrsRdpSampleClass extends SRSReportDataProviderBase

{

TmpCustTableSample tmpCust;

}

Defining a Data Contract Class

An RDP class must have a data contract if the report has one or more report parameters. This example defines three report parameters for account number, account statement, and whether to include tax. When you print the report, you can specify which data to print based on the report parameters. For example, you can specify to only print transactions for account number 4000.

A data contract is an X++ class with getters, setters, and the DataMemberAttribute attribute. The data contract defines the parameters that the report uses.

To define a data contract class

  1. In the AOT, right-click the Classes node, and then select New Class.
  2. Right-click the new class, click Rename, and then enter SrsRDPContractSample.
  3. Expand SrsRDPContractSample, right-click classDeclaration, and then click View Code.
  4. In code editor, enter the following code in the class declaration to define the class.

X++

[DataContractAttribute]

public class SrsRDPContractSample

{

AccountNum accountNum;

CustAccountStatement accountStmt;

boolean inclTax;

}

A data contract class has methods with the DataMemberAttribute attribute. The name that follows this attribute is the parameter name that displays in Visual Studio when you bind a report data set to the RDP class. In this section, add a method for each of the report parameters and name them parmAccountNum, parmAccountStmt, and parmInclTax.

To define data contract methods

  1. Right-click SrsRDPContractSample, point to New, and then click Method.
  2. Edit the method so that it contains the following code.

X++

[DataMemberAttribute("AccountNum")]

public AccountNum parmAccountNum(AccountNum _accountNum = accountNum)

{

accountNum = _accountNum;

return accountNum;

}

  1. Right-click SrsRDPContractSample, point to New, and then click Method.
  2. Edit the method so that it contains the following code.

X++

[DataMemberAttribute("CustAccountStatement")]

public CustAccountStatement parmAccountStmt(CustAccountStatement _accountStmt = accountStmt)

{

accountStmt = _accountStmt;

return accountStmt;

}

  1. Right-click SrsRDPContractSample, point to New, and then click Method.
  2. Edit the method so that it contains the following code.

X++

[DataMemberAttribute("InclTax")]

public boolean parmInclTax(boolean _inclTax = inclTax)

{

inclTax = _inclTax;

return inclTax;

}

Defining a Method to Return Data to Reporting Services

A method to return the processed data in the temporary table to Reporting Services is needed. In this section, add a method named getTmpCustTable and attach the SRSReportDataSetAttribute attribute to indicate the dataset for the report.

To define a method to return the data to Reporting Services

  1. Right-click SrsRdpSampleClass, point to New, and then click Method.
  2. Edit the method so that it contains the following code.

X++

[SRSReportDataSetAttribute("TmpCust")]

public TmpCustTableSample getTmpCustTable()

{

select * from tmpCust;

return tmpCust;

}

Adding Business Logic for the Report

The business logic for this example prompts the end user for parameter values, processes business logic to generate data in a table, and then returns the table to render in the report.

The report business logic is provided in the processReport method. This method is called by Reporting Services at runtime. The following example illustrates how the processReport method computes data and populates the data table that is returned to Reporting Services. In this section, override the processReport method to provide business logic for your report.

To add business logic for the report

  1. Right-click SrsRdpSampleClass, point to Override method, and then click processReport.
  2. Edit the method so that it contains the following code.

X++

public void processReport()

{

AccountNum accountNumber;

CustAccountStatement custAcctStmt;

boolean boolInclTax;

Query query;

QueryRun queryRun;

QueryBuildDataSource queryBuildDataSource;

QueryBuildRange queryBuildRange;

CustTable queryCustTable;

SrsRdpContractSample dataContract;

// Get the query from the runtime using a dynamic query.

// This base class method reads the query specified in the SRSReportQueryAttribute attribute.

query = this.parmQuery();

// Get the parameters passed from runtime.

// The base class methods read the SRSReportParameterAttribute attribute.

dataContract = this.parmDataContract();

accountNumber = dataContract.parmAccountNum();

custAcctStmt = dataContract.parmAccountStmt();

boolInclTax = dataContract.parmInclTax();

// Add parameters to the query.

queryBuildDataSource = query.dataSourceTable(tablenum(CustTable));

if(accountNumber)

{

queryBuildRange = queryBuildDataSource.findRange(fieldnum(CustTable, AccountNum));

if (!queryBuildRange)

{

queryBuildRange = queryBuildDataSource.addRange(fieldnum(CustTable, AccountNum));

}

// If an account number has not been set, then use the parameter value to set it.

if(!queryBuildRange.value())

queryBuildRange.value(accountNumber);

}

if(custAcctStmt)

{

queryBuildRange = queryBuildDataSource.findRange(fieldnum(CustTable, AccountStatement));

if (!queryBuildRange)

{

queryBuildRange = queryBuildDataSource.addRange(fieldnum(CustTable, AccountStatement));

}

// If an account statement has not been set, then use the parameter value to set it.

if(!queryBuildRange.value())

queryBuildRange.value(int2str(custAcctStmt));

}

if(boolInclTax)

{

queryBuildRange = queryBuildDataSource.findRange(fieldnum(CustTable, InclTax));

if (!queryBuildRange)

{

queryBuildRange = queryBuildDataSource.addRange(fieldnum(CustTable, InclTax));

}

// If flag to include tax has not been set, then use the parameter value to set it.

if(!queryBuildRange.value())

queryBuildRange.value(int2str(boolInclTax));

}

// Run the query with modified ranges.

queryRun = new QueryRun(query);

ttsbegin;

while(queryRun.next())

{

tmpCust.clear();

queryCustTable = queryRun.get(tablenum(CustTable));

        tmpCust.AccountNum = queryCustTable.AccountNum;

        tmpCust.CustName = queryCustTable.name();

        tmpCust.LogisticsAddressing = queryCustTable.address();

        tmpCust.CustGroupId = queryCustTable.CustGroup;

        tmpCust.Phone = queryCustTable.phone();

        tmpCust.CustInvoiceAccount = queryCustTable.InvoiceAccount;

        tmpCust.CustAccountStatement = queryCustTable.AccountStatement;

        tmpCust.InclTax = queryCustTable.InclTax;

        tmpCust.insert();

}

ttscommit;

}

Creating a Reporting Project

Next, create a reporting project in Microsoft Visual Studio. When you create a reporting project, you use the Report Model to create a Reporting Services report.

To create a reporting project

  1. Open Microsoft Visual Studio.
  2. On the File menu, point to New, and then click Project. The New Project dialog box displays.
  3. In the Installed Templates pane, click Microsoft Dynamics AX. In the Templates pane, click Report Model.
  4. In the Name box, type SampleRDPReport, and in the Location box, type a location.
  5. Click OK.

A reporting project contains a report model where you can add a report to the model.

Binding a Report to a Report Data Provider Class

Now that you have created a reporting project, you are ready to define an auto design report that displays data from the Cust query. The following procedure explains how to create an auto design report that uses the RDP class as the data source.

To create an auto design report

  1. In Solution Explorer, right-click the ReportModel node, point to Add and then click Report.
  2. In Model Editor, right-click the Report1 node, and then click Rename.
  3. Type CustomerReport as the name.
  4. Right-click the Datasets node, and then click Add Dataset.
  5. In the Properties window, specify the following values.

Property

Value

Data Source

Dynamics AX

Data Source Type

Report Data Provider

Default Layout

Table

Dynamic Filters

True

clip_image001[1]Note

This setting is for dynamic parameters on the report. Setting the property to True allows you to filter the report by setting a range on any fields from the data source table.

Name

Customer

Query

Click the ellipsis button (…). A dialog box displays where you can select an RDP class that is defined in the AOT and identify the fields that you want to use. Select the SrsRDPSampleClass class and click Next. In the Select Fields dialog box, keep all the checkboxes selected, and click OK.

clip_image001[2]Note

Based on what you select, the Query property value is updated. In this case, the query is SELECT * FROM SrsRDPSampleClass.TmpCust.

  1. In Model Editor, select the Customer node and drag it onto the Designs node. An auto design named AutoDesign1 is created for the report.

clip_image001[3]Note

If you expand the Parameters node you see the parameters that you defined in the data contract class. When you define nested data contract parameters, they are listed under the Parameters node also.

Select the SrsRDPSampleClass_DynamicParameter parameter. In the Properties window, the AOT Query property is set to the query specified in the parmQuery method in the RDP class.

  1. Select AutoDesign1 and then click the Preview button.
  2. Enter a value for Account number and Account statement that returns data and then click the Report tab to preview the report.

clip_image001[4]Note

You can use * to display all of the account numbers on the report. Account statement is an enumeration and there is no wild card value for enumerations. Check your sample data to determine a valid enumeration value for Account statement.

The Select button displays because you set the Dynamic Filters property to True on the dataset. You have the option to click the Select button to specify a range to filter the report and limit the data that displays on the report.

The next steps are to add layout and style templates, deploy, and add the report to a menu item so you can see it in Microsoft Dynamics AX.

How to: Grant User Access to a Report Server (Report Manager)

Reporting Services uses role-based security to grant user access to a report server. On a new report server installation, only users who are members of the local Administrators group have permissions to report server content and operations. To make the report server available to other users, you must create role assignments that map  user or group accounts to a predefined role that specifies a collection of tasks.

For a report server that is configured for native mode, use Report Manager to assign users to a role. There are two types of roles:

  • Item-level roles are used to view, add, and manage report server content, subscriptions, report processing, and report history. Item-level role assignments are defined on the root node (the Home folder) or on specific folders or items farther down the hierarchy.

  • System-level roles grant access to site-wide operations that are not bound to any specific item. Examples include using Report Builder and using shared schedules.

    The two types of roles complement each other and should be used together. For this reason, adding a user to a report server is a two-part operation. If you assign a user to an item-level role, you should also assign them to a system-level role. When assigning a user to a role, you must select a role that is already defined. To create, modify, or delete roles, use SQL Server Management Studio.

For a report server that is configured for SharePoint integrated mode, you configure access from a SharePoint site using SharePoint permissions. Permission levels on the SharePoint site determine access to report server content and operations. You must be a site administrator to grant permissions on a SharePoint site.

Before you start

Review the following list before adding users to a native mode report server.

  • You must be a member of the local Administrators group on the report server computer. If you are deploying Reporting Services on Windows Vista or Windows Server 2008, additional configuration is required before you can administer a report server locally.

  • To delegate this task to other users, create role assignments that map user accounts to Content Manager and System Administrator roles. Users who have Content Manager and System Administrator permissions can add users to a report server.

  • In SQL Server Management Studio, view the predefined roles for System Roles and User Roles so that you are familiar with the kinds of tasks in each role. Task descriptions are not visible in Report Manager, so you will want to be familiar with the roles before you begin adding users.

  • Optionally, customize the roles or define additional roles to include the collection of tasks that you require. For example, if you plan to use custom security settings for individual items, you might want to create a new role definition that grants view-access to folders.

To add a user or group to a system role
  1. Start Report Manager.

  2. Click Site Settings.

  3. Click Security.

  4. Click New Role Assignment.

  5. In Group or user name, enter a Windows domain user or group account in this format: <domain>\<account>. If you are using forms authentication or custom security, specify the user or group account in the format that is correct for your deployment.

  6. Select a system role, and then click OK.

    Roles are cumulative, so if you select both System Administrator and System User, a user or group will be able to perform the tasks in both roles.

  7. Repeat to create assignments for additional users or groups.

To add a user or group to an item role
  1. Start Report Manager and locate the report item for which you want to add a user or group.

  2. Hover over the item, and click the drop-down arrow.

  3. In the drop-down menu, click Security.

  4. Click New Role Assignment.

    Note: If an item currently inherits security from a parent item, click Edit Item Security in the toolbar to change the security settings. Then click New Role Assignment.

  5. In Group or user name, enter a Windows domain user or group account in this format: <domain>\<account>. If you are using forms authentication or custom security, specify the user or group account in the format that is correct for your deployment.

  6. Select one or more role definitions that describe how the user or group should access the item, and then click OK.

  7. Repeat to create assignments for additional users or groups.

Procedure: Grant Users Access to Reports in AX 2012

Configure security settings in Microsoft Dynamics AX
Complete the following tasks in Microsoft Dynamics AX:
• Determine which reports each Microsoft Dynamics AX role should have access to.
• Verify that each Microsoft Dynamics AX role has the correct duties and privileges assigned to it in order to access the reports.
• Assign users to Microsoft Dynamics AX roles.
• Secure the data shown in reports.

Configure security settings in Reporting Services Complete the following tasks in Reporting Services:
• Assign users to the DynamicsAXBrowser role in Reporting Services.
For detailed instructions about how to assign users to Reporting Services roles, refer to my post (How to: Grant User Access to a Report Server).
• Identify the account that is used to run the Application Object Server (AOS) service and the account that is used as the Business Connector proxy. Assign those accounts to the DynamicsAXBrowser role in Reporting Services.
• Restrict access to report folders and reports. Reporting Services includes security features and tools that you should use to help control access to report folders and published reports. Refer to the SQL Server documentation on MSDN for detailed conceptual information and step-by-step tutorials that will help you administer
security in Reporting Services.

Setting Time-out Values for Report and Shared Dataset Processing (SSRS)


You can specify time-out values to set limits on how system resources are used. Report server supports two time-out values:

  • An embedded dataset query time-out value is the number of seconds that the report server waits for a response from the database. This value is defined in a report.

  • A shared dataset query time-out value is the number of seconds that the report server waits for a response from the database. This value is part of the shared dataset definition and can be changed when you manage the shared dataset on the report server.

  • A report execution time-out value is the maximum number of seconds that report processing can continue before it is stopped. This value is defined at the system level. You can vary this setting for individual reports.

Most time-out errors occur during query processing. If you are encountering time-out errors, try increasing the query time-out value. Make sure to adjust the report execution time-out value so that it is larger than the query time-out. The time period should be sufficient to complete both query and report processing.

Setting a Query Time-Out for an Embedded Dataset in a Report

Query time-out values are specified during report authoring when you define an embedded dataset. The time-out value is stored with the report, in theTimeout element of the report definition. By default, this value is set to 30 seconds.

Users who have permission to modify the properties of a published report can reset this value by editing the report definition file.

You can also specify a query time-out value for data-driven subscriptions. The query time-out value is specified in the Data-Driven Subscription pages. The value you specify determines how long the report server waits for query processing to complete when retrieving data from the subscriber data source.

Setting a Query Time-Out for a Shared Dataset

Query time-out values are specified in seconds on the report server when you create or manage a shared dataset. By default, this value is set to 0 seconds, which is the equivalent of no time-out value.

Setting Report Processing Time-Out

You can set the report processing time-out value to limit the amount of time that a report server uses to process a report. Report processing time-out values can be changed using two different procedures:

  • Use Report Manager. You can set a default value for all reports in the Site Settings page, and you can override that value in the Execution properties page for a specific report. By default, the value is set to 1800 seconds.

  • Use SQL Server Management Studio (SSMS).You can set the execution time-out for all reports. In SSMS, Right-click the name of a report server, then click Properties. On the Server Properties window, click the Execution page and change the value for Limit report execution to the following number of seconds.

How Report Execution Time-Out Values are Evaluated

The report server evaluates running jobs at 60 second intervals. At each 60 second interval, the report server compares actual process time against the report execution time-out value. If the processing time for a report exceeds the report execution time-out value, report processing will stop.

Note that if you specify a time-out value that is smaller than 60 seconds, the report may execute in full if processing starts and completes during the quiet part of the cycle when the report server is not evaluating running jobs. For example, if you set a time-out value of 10 seconds for a report that takes 20 seconds to run, the report will process in full if report execution starts early in the 60 second cycle.

NoteNote

You can set the RunningRequestsDbCycle setting in the RSReportServer.config file to change the frequency of how often running jobs are evaluated.

How To SSRS Parameter to Current Month using an SSAS Data Source


Imparted from here

When dealing with report parameters that involve time, I usually like to default the report to the current unit of time used by the report, often month.  When a user views the report in a particular month the parameter will always default to that month, saving the user from having to select it every time.

There are two elements to making this happen.  One is to define the current month in your Time dimension,  and the other is to build the dataset into your report to feed the default for the Time parameters.

1. Define current month in the SSAS Time dimension

I know there is Time functionality built into SSAS cubes, but I still like the flexibility of building attributes into my DIM_Date table in the data warehouse.  In this way it can be used in both cube and SQL queries alike.  I won’t go into details about how the Dim_Date table is created as that is another subject.  The DIM_Date table is rebuilt nightly and an attribute called MonthPeriod identifies whether the date is in Current Month, Previous Month, etc.  You can label any months you like, with your own descriptions.  Some examples are below.

image

The important thing about this attribute is to ensure that MonthPeriodID for the current month is always 0, and the MonthPeriodID for other months is relative to that. So ‘Current Month –1’ is 1, ‘Current Month –2’ will be 2, etc. This way you can build logic into your reports which relies on the fact that, for example, last month has a MonthPeriodID of 1.  It is critically important that the underlying ids belonging to each description are always the same.  If Current Month is 0 today and changes to 10 tomorrow, the defaults in your reports will not work.  SSRS stores the MDX tuple associated with the description and not the actual description. So when you select ‘Current Month’ in step 3 below, SSRS is storing [TIME].[Month Period].&[0] and not the ‘Current Month’ label.

Once you have this attribute defined in your DIM_Date table and it is being updated nightly, add it to the SSAS cube for use in your reports.

2. Build the default dataset into your report to feed the SSRS Parameter.

Background:

When you build the main dataset for the report and add parameters in your dataset,

image

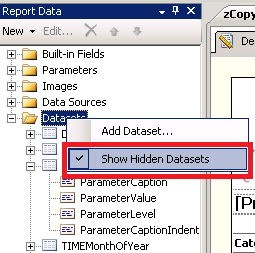
SSRS automatically creates the dataset for the Available Values for the parameter. You can view these hidden datasets used to feed Available Values by right clicking on [Datasets] in the [Report Data] window in SSRS and selecting [Show Hidden Datasets]. 

image

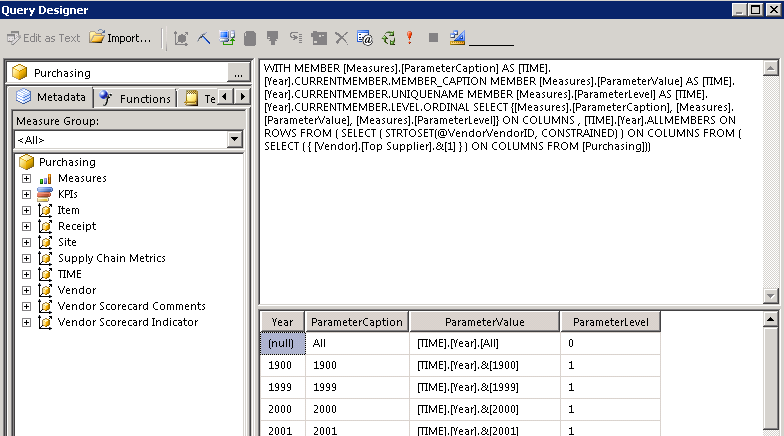
You can view and/or edit any of these hidden datasets.

image

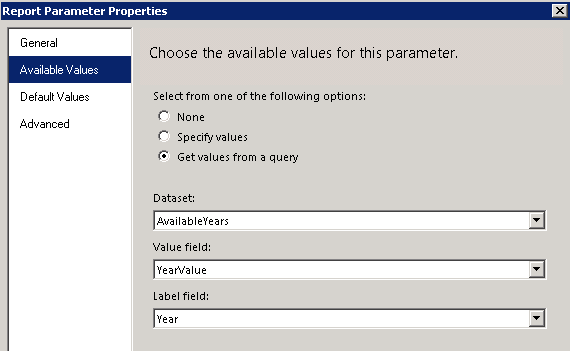
I don’t recommend editing the hidden datasets, since they are created and used by SSRS by default and your changes can sometimes be overwritten if you add additional datasets using the same parameters.  If you wish to customize the Available Values you are better off creating a new dataset with a different name specific to that purpose and then changing Report Parameter Properties to use the new dataset to retrieve the Available Values.

image

Building the Default Dataset

For this particular report the user can choose Year and then Month Of Year.  The same dataset can be used to feed both the default current year and the current month. 

1. Right click on Datasets in the Report Data window and select Add Dataset.

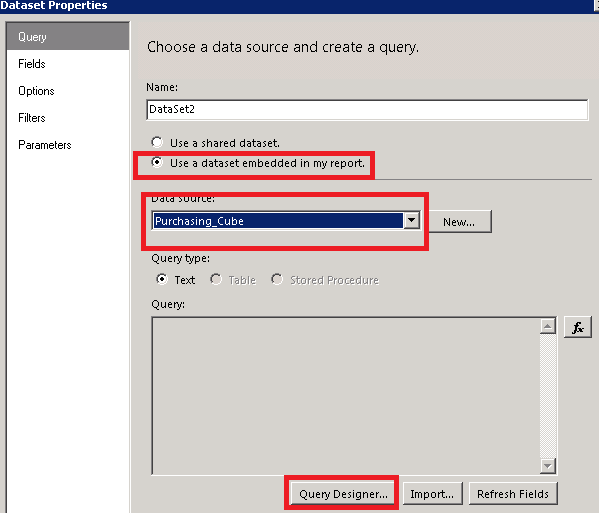
2. Select the Radio Button ‘Use a dataset embedded in my report’.  I like to use Shared Datasets for this type of thing, but for some reason shared datasets used for defaults with an SSAS data source don’t seem to work when published to SharePoint.  So for now just embed it in the report.  Select (or define) the cube you are using as your Data source, and click on the Query Designer button.

image

3. From the TIME dimension drag the ‘Month Period’ attribute defined in Part 1 to the filter area of the Query Designer.  Click in the Filter Expression and select ‘Current Month’. Click OK.

image

4.  Drag Year and Month of Year onto the Query design page.  Right click on the design page and select ‘Include Empty Cells’ so the current attributes will appear when the query is executed.

image

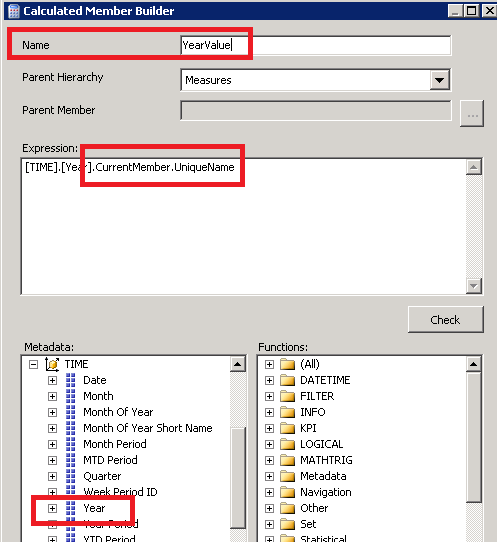
5. Right click in the Calculated Members area and select ‘New Calculated Member’.  From the Metadata pane drag the Year attribute from the TIME dimension into the Expression pane.  Add to the end of the expression “.CurrentMember.UniqueName”.  Give the Calculated Member a name of ‘YearValue’.  Click OK.

image

6. Right click on the new calculated member called YearValue and select Add to Query.

image

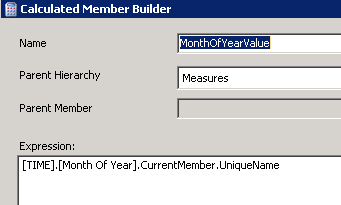
7.  Add another calculated member following steps 5 & 6 called MonthOfYearValue. 

image

8. Your dataset now contains the Label and the underlying MDX tuple needed to feed the default time values to your report parameter.

image

9. Click OK to close out of the Query Designer.  Give the dataset a name of DefaultYearMonth. Click OK to save the dataset.

10. Double click the TIMEYear parameter in the Paramaters folder of the Report Data window to edit the Report Parameter Properties. Select the Default Values option. Choose the ‘Get values from a query’ radio button.  In the dataset drop down choose the DefaultYearMonth dataset you created.  In the Value field dropdown select YearValue.

image

11. Do the same as Step 10 for the TIMEMonthOfYear parameter.  Select DefaultYearMonth as the dataset, and MonthOfYearValue for the Value field.

When you preview your report, the parameters will now default to the current year and month.  Going forward the default for the parameter will roll over to whichever month is current.  Users appreciate not having to choose the current month every time they look at a report.

image

Creating a Basic Table Report (SSRS)

This post will help you create a basic table report based on the AdventureWorks2008R2 database using Report Designer. You can also use Report Builder or the Report Wizard to create reports. In this post, you will create a report project, set up connection information, define a query, add a Table data region, group and total some fields, and preview the report.

Create a report server project
  1. Click Start, point to Programs, point to Microsoft SQL Server 2008 R2, and then click Business Intelligence Development Studio.

  2. On the File menu, point to New, and then click Project.

  3. In the Project Types list, click Business Intelligence Projects.

  4. In the Templates list, click Report Server Project.

  5. In Name, type Tutorial.

  6. Click OK to create the project.

    The Tutorial project is displayed in Solution Explorer.

Create a new report definition file
  1. In Solution Explorer, right-click Reports, point to Add, and click New Item.

  2. In the Add New Item dialog box, under Templates, click Report.

  3. In Name, type Sales Orders.rdl and then click Add, Report Designer opens and displays the new .rdl file in Design view.

Set up a connection
  1. In the Report Data pane, click New and then click Data Source ( If the Report Data pane is not visible, from the View menu, click Report Data ).

  2. In Name, type AdventureWorks2008R2.

  3. Make sure Embedded connection is selected.

  4. In Type, select Microsoft SQL Server.

  5. In Connection string, type the following:

    Data source=localhost; initial catalog=AdventureWorks2008R2

    This connection string assumes that Business Intelligence Development Studio, the report server, and the AdventureWorks2008R2 database are all installed on the local computer and that you have permission to log on to the AdventureWorks2008R2 database.

    If you are using SQL Server Express with Advanced Services or a named instance, the connection string must include instance information:

    Data source=localhost\SQLEXPRESS; initial catalog=AdventureWorks2008R2


  6. Click OK. A data source called AdventureWorks2008R2 is added to the Report Data pane.


Define a Transact-SQL query for report data


  1. In the Report Data pane, click New, and then click Dataset. The Dataset Properties dialog box opens.


  2. In the Name box, type AdventureWorksDataset.


  3. Click the Use a dataset embedded in my report radio button. Make sure the name of your data source, AdventureWorks, is in the Data source text box, and that the Query type is Text.


  4. Type, or copy and paste, the following Transact-SQL query into the Query box.

    SELECT 
    soh.OrderDate AS [Date],
    soh.SalesOrderNumber AS [Order],
    pps.Name AS Subcat, pp.Name as Product,
    SUM(sd.OrderQty) AS Qty,
    SUM(sd.LineTotal) AS LineTotal
    FROM Sales.SalesPerson sp
    INNER JOIN Sales.SalesOrderHeader AS soh
    ON sp.BusinessEntityID = soh.SalesPersonID
    INNER JOIN Sales.SalesOrderDetail AS sd
    ON sd.SalesOrderID = soh.SalesOrderID
    INNER JOIN Production.Product AS pp
    ON sd.ProductID = pp.ProductID
    INNER JOIN Production.ProductSubcategory AS pps
    ON pp.ProductSubcategoryID = pps.ProductSubcategoryID
    INNER JOIN Production.ProductCategory AS ppc
    ON ppc.ProductCategoryID = pps.ProductCategoryID
    GROUP BY ppc.Name, soh.OrderDate, soh.SalesOrderNumber, pps.Name, pp.Name,
    soh.SalesPersonID
    HAVING ppc.Name = 'Clothing'


  5. (Optional) Click the Query Designer button. The query is displayed in the text-based query designer. You can toggle to the graphical query designer by clicking Edit As Text. View the results of the query by clicking the Run (!) button on the query designer toolbar.

    You see the data from six fields from four different tables in the AdventureWorks2008R2 database. The query makes use of Transact-SQL functionality such as aliases. For example, the SalesOrderHeader table is called soh.

    Click OK to exit the query designer.


  6. Click OK to exit the Dataset Properties dialog box.

    Your AdventureWorksDataset dataset fields appear in the Report Data pane.


Adding a Table to the Report (Reporting Services)


To Add a Table data region and fields to a report layout


  1. In the Toolbox, click Table, and then click on the design surface. Report Designer draws a table data region with three columns in the center of the design surface.

    NoteNote

    The Toolbox may appear as a tab on the left side of the Report Data pane. To open the Toolbox, move the pointer over the Toolbox tab. If the Toolbox is not visible, from the View menu, click Toolbox.


  2. In the Report Data pane, expand the AdventureWorksDataset dataset to display the fields.


  3. Drag the Date field from the Report Data pane to the first column in the table.

    When you drop the field into the first column, two things happen. First, the data cell will display the field name, known as the field expression, in brackets: [Date]. Second, a column header value is automatically added to Header row, just above the field expression. By default, the column is the name of the field. You can select the Header row text and type a new name.


  4. Drag the Order field from the Report Data pane to the second column in the table.


  5. Drag the Product field from the Report Data pane to the third column in the table.


  6. Drag the Qty field to the right edge of the third column until you get a vertical cursor and the mouse pointer includes a plus sign [+]. When you release the mouse button, a fourth column is created for [Qty].


  7. Add the LineTotal field in the same way, creating a fifth column.

    The column header is Line Total. Report Designer automatically creates a friendly name for the column by splitting LineTotal into two words.

    The following diagram shows a table data region that has been populated with these fields: Date, Order, Product, Qty, and Line Total.

    Design, Table with header row and detail row


Preview Your Report


Previewing a report enables you to easily view the rendered report without having to first publish it to a report server. You will probably want to preview your report frequently during design time.

To Preview a report


  • Click the Preview tab. Report Designer runs the report and displays it in Preview view.

    The following diagram shows part of the report in Preview view.

    Preview, Detail rows of table with 5 columns

    Notice that the currency (in the Line Total column) has six places after the decimal, and the date has an unnecessary time stamp. You're going to fix that formatting in the next lesson.


Now that you've added a table and some fields to the Sales Orders report, you can format the date and currency fields and the column headers.

Format the Date


The Date field displays date and time information by default. You can format it to display only the date.

Format a date field


  1. Click the Design tab.


  2. Right-click the cell with the [Date] field expression and then click Text BoxProperties.


  3. Click Number, and then in the Category field, select Date.


  4. In the Type box, select January 31, 2000.


  5. Click OK.


Format the Currency


The LineTotal field displays a general number. Format it to display the number as currency.

To format a currency field


  1. Right-click the cell with the [LineTotal] field expression and then click Text BoxProperties.


  2. Click Number, and in the Category field, select Currency.


  3. If your regional setting is English (United States), the defaults should be:


    • Decimal places: 2


    • Negative numbers: ($12345.00)


    • Symbol: $ English (United States)


  4. Select Use 1000 separator (,).

    If the sample text is: $12,345.00, then your settings are correct.


  5. Click OK.


Change Text Style and Column Widths


You can also change the formatting of the header row to differentiate it from the rows of data in the report. Lastly, you will adjust the widths of the columns.

To format header rows and table columns


  1. Click the table so that column and row handles appear above and next to the table.

    Design, Table with header row and detail row

    The gray bars along the top and side of the table are the column and row handles.


  2. Point to the line between column handles so that the cursor changes into a double-headed arrow. Drag the columns to the size you want.


  3. Select the row containing column header labels and from the Format menu, point to Font and then click Bold.


  4. To preview your report, click the Preview tab. It should look something like this:

    Preview of table with bold column headers


Grouping Data in A report

To group data in a report


  1. Click the Design tab.


  2. From the Report Data pane, drag the Date field to the Row Groups pane. Place it above the row called Details.

    Note that the row handle now has a bracket in it, to show a group. The table now also has two Date columns -- one on either side of a vertical dotted line.

    Date field added to Row Groups pane


  3. From the Report Data pane, drag the Order field to the Row Groups pane. Place it below Date and above Details.

    Note that the row handle now has two brackets in it, to show two groups. The table now has two Order columns, too.


  4. Delete the original Date and Order columns to the right of the double line. This removes this individual record values so that only the group value is displayed. Select the column handles for the two columns, right-click and click Delete Columns.

    Select columns to delete

    You can format the column headers and date again.


  5. Switch to the Preview tab to preview the report. It should look similar to the following illustration:

    Table grouped by date and then order


To add totals to a report


  1. Switch to Design view.


  2. Right-click the data region cell that contains the field [LineTotal], and click Add Total.

    This adds a row with a sum of the dollar amount for each order.


  3. Right-click the cell that contains the field [Qty], and click Add Total.

    This adds a sum of the quantity for each order to the totals row.


  4. In the empty cell to the left of Sum[Qty], type the label "Order Total".


  5. You can add a background color to the totals row. Select the two sum cells and the label cell.


  6. On the Format menu, click Background Color and click Light Gray.

    Design view: Basic table with order total


To add a daily total to a report


  1. Right-click the Order cell, point to Add Total, and click After.

    This adds a new row containing sums of the quantity and dollar amount for each day, and the label "Total" in the Order column.


  2. Type the word Daily before the word Total in the same cell, so it reads Daily Total.


  3. Select the Daily Total cell, the two Sum cells and the empty cell between them.


  4. On the Format menu, click Background Color and click Orange.

    Design view: Daily total row in basic table


To add a grand total to a report


  1. Right-click the Date cell, point to Add Total, and click After.

    This adds a new row containing sums of the quantity and dollar amount for the entire report, and the Total label in the Date column.


  2. Type the word Grand before the word Total in the same cell, so it reads Grand Total.


  3. Select the Grand Total cell, the two Sum cells and the empty cells between them.


  4. On the Format menu, click Background Color and click Light Blue.

    Design view: Grand total in basic table


  5. Click Preview.

    The last page should look something like this, although your Order Total, Daily Total, and Grand Total may be on a second page:

    Preview: Basic table with grand total